Ultra Portable
DATS-solo
The DATS-solo is a pocket-sized, ultra portable, high quality, 24-bit data acquisition system. It is compact, rugged and has 4 inputs selectable as IEPE, voltage or tachometer inputs. The fully integrated DATS software provides options for sound & vibration tests, rotating machinery analysis, NVH studies, hammer impact analysis, resonance testing and modal analysis.

Portable, Reliable, Accurate
DATS-tetrad
The DATS-tetrad is a rugged, portable data acquisition system with up to 32 high speed analog inputs. Sensor options are include IEPE/voltage (accels, mics etc), strain gauges, thermocouples, tachos and CAN. It can be powered from mains, vehicle or internal battery. The Tetrad is a standalone front end or can be distributed for >1000 channels.

Complexity Made Simple
DATS Software
DATS is a comprehensive package of data capture, signal processing and reporting tools. It has focused tools for sound and vibration measurement & analysis and is used for a wide range of engineering and general signal processing tasks. The core package provides basic analysis tools and a number of optional packs address particular types of analysis.

High Channel Count
DATS-hyper12
The DATS-hyper12 is the high channel count member of the Prosig DATS data acquisition system family. It is ideal for large scale acoustic & vibration measurement tasks. The unit is available in portable or rack-mount form and a single system can support 96 high speed analogue inputs. Units can be stacked to expand the system to >1000 channels.
Easy CAN-bus Logging
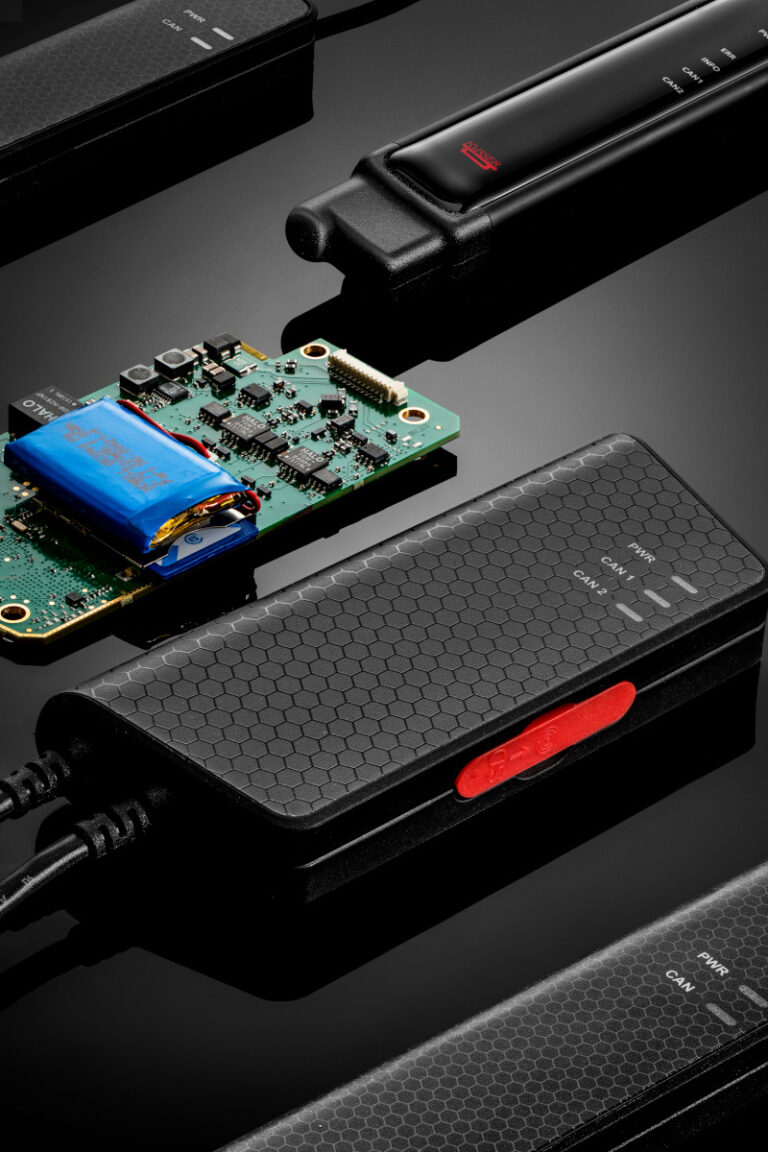
DATS-CANetic
The DATS-CANetic is a set of integrated software tools in DATS and a small, rugged, CAN-bus logger from Kvaser. It is ideal for quick access to vehicle bus data. The easy to use software allows the user to start logging in minutes. Recorded data is automatically synchronised and integrated with the Prosig data acquisition systems.

Hammer Impact Testing
DATS-HITS
Impact testing (bump testing, tap testing, or resonance testing) uses an instrumented hammer to excite a structure and measure the response. The DATS-HITS solution is straightforward, simple, fast, reliable and accurate. It includes a 4-channel DATS-solo data capture system, the DATS Hammer Impact software and, optionally, a hammer and accelerometers.
Entry Level Starter
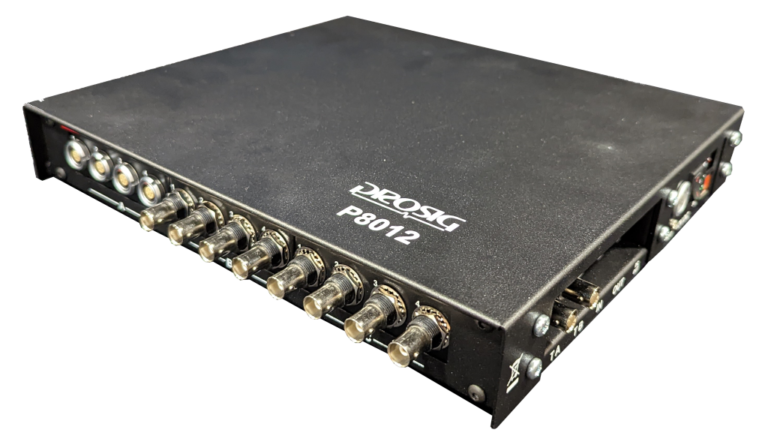
DATS-P8012
The P8012 supports up to 24 high speed analog inputs plus two tachos. P8012's can be used alone or connected with Tetrad, Hyper12 or other P8012s for flexible channel configurations. The same input options for the DATS-tetrad can be used in a P8012. If you need high precision measurement then the DATS-P8012 is an ideal entry-level system that can upgraded later.